
The Obscured 42%: What a Decade of Hidden Emissions Reveals
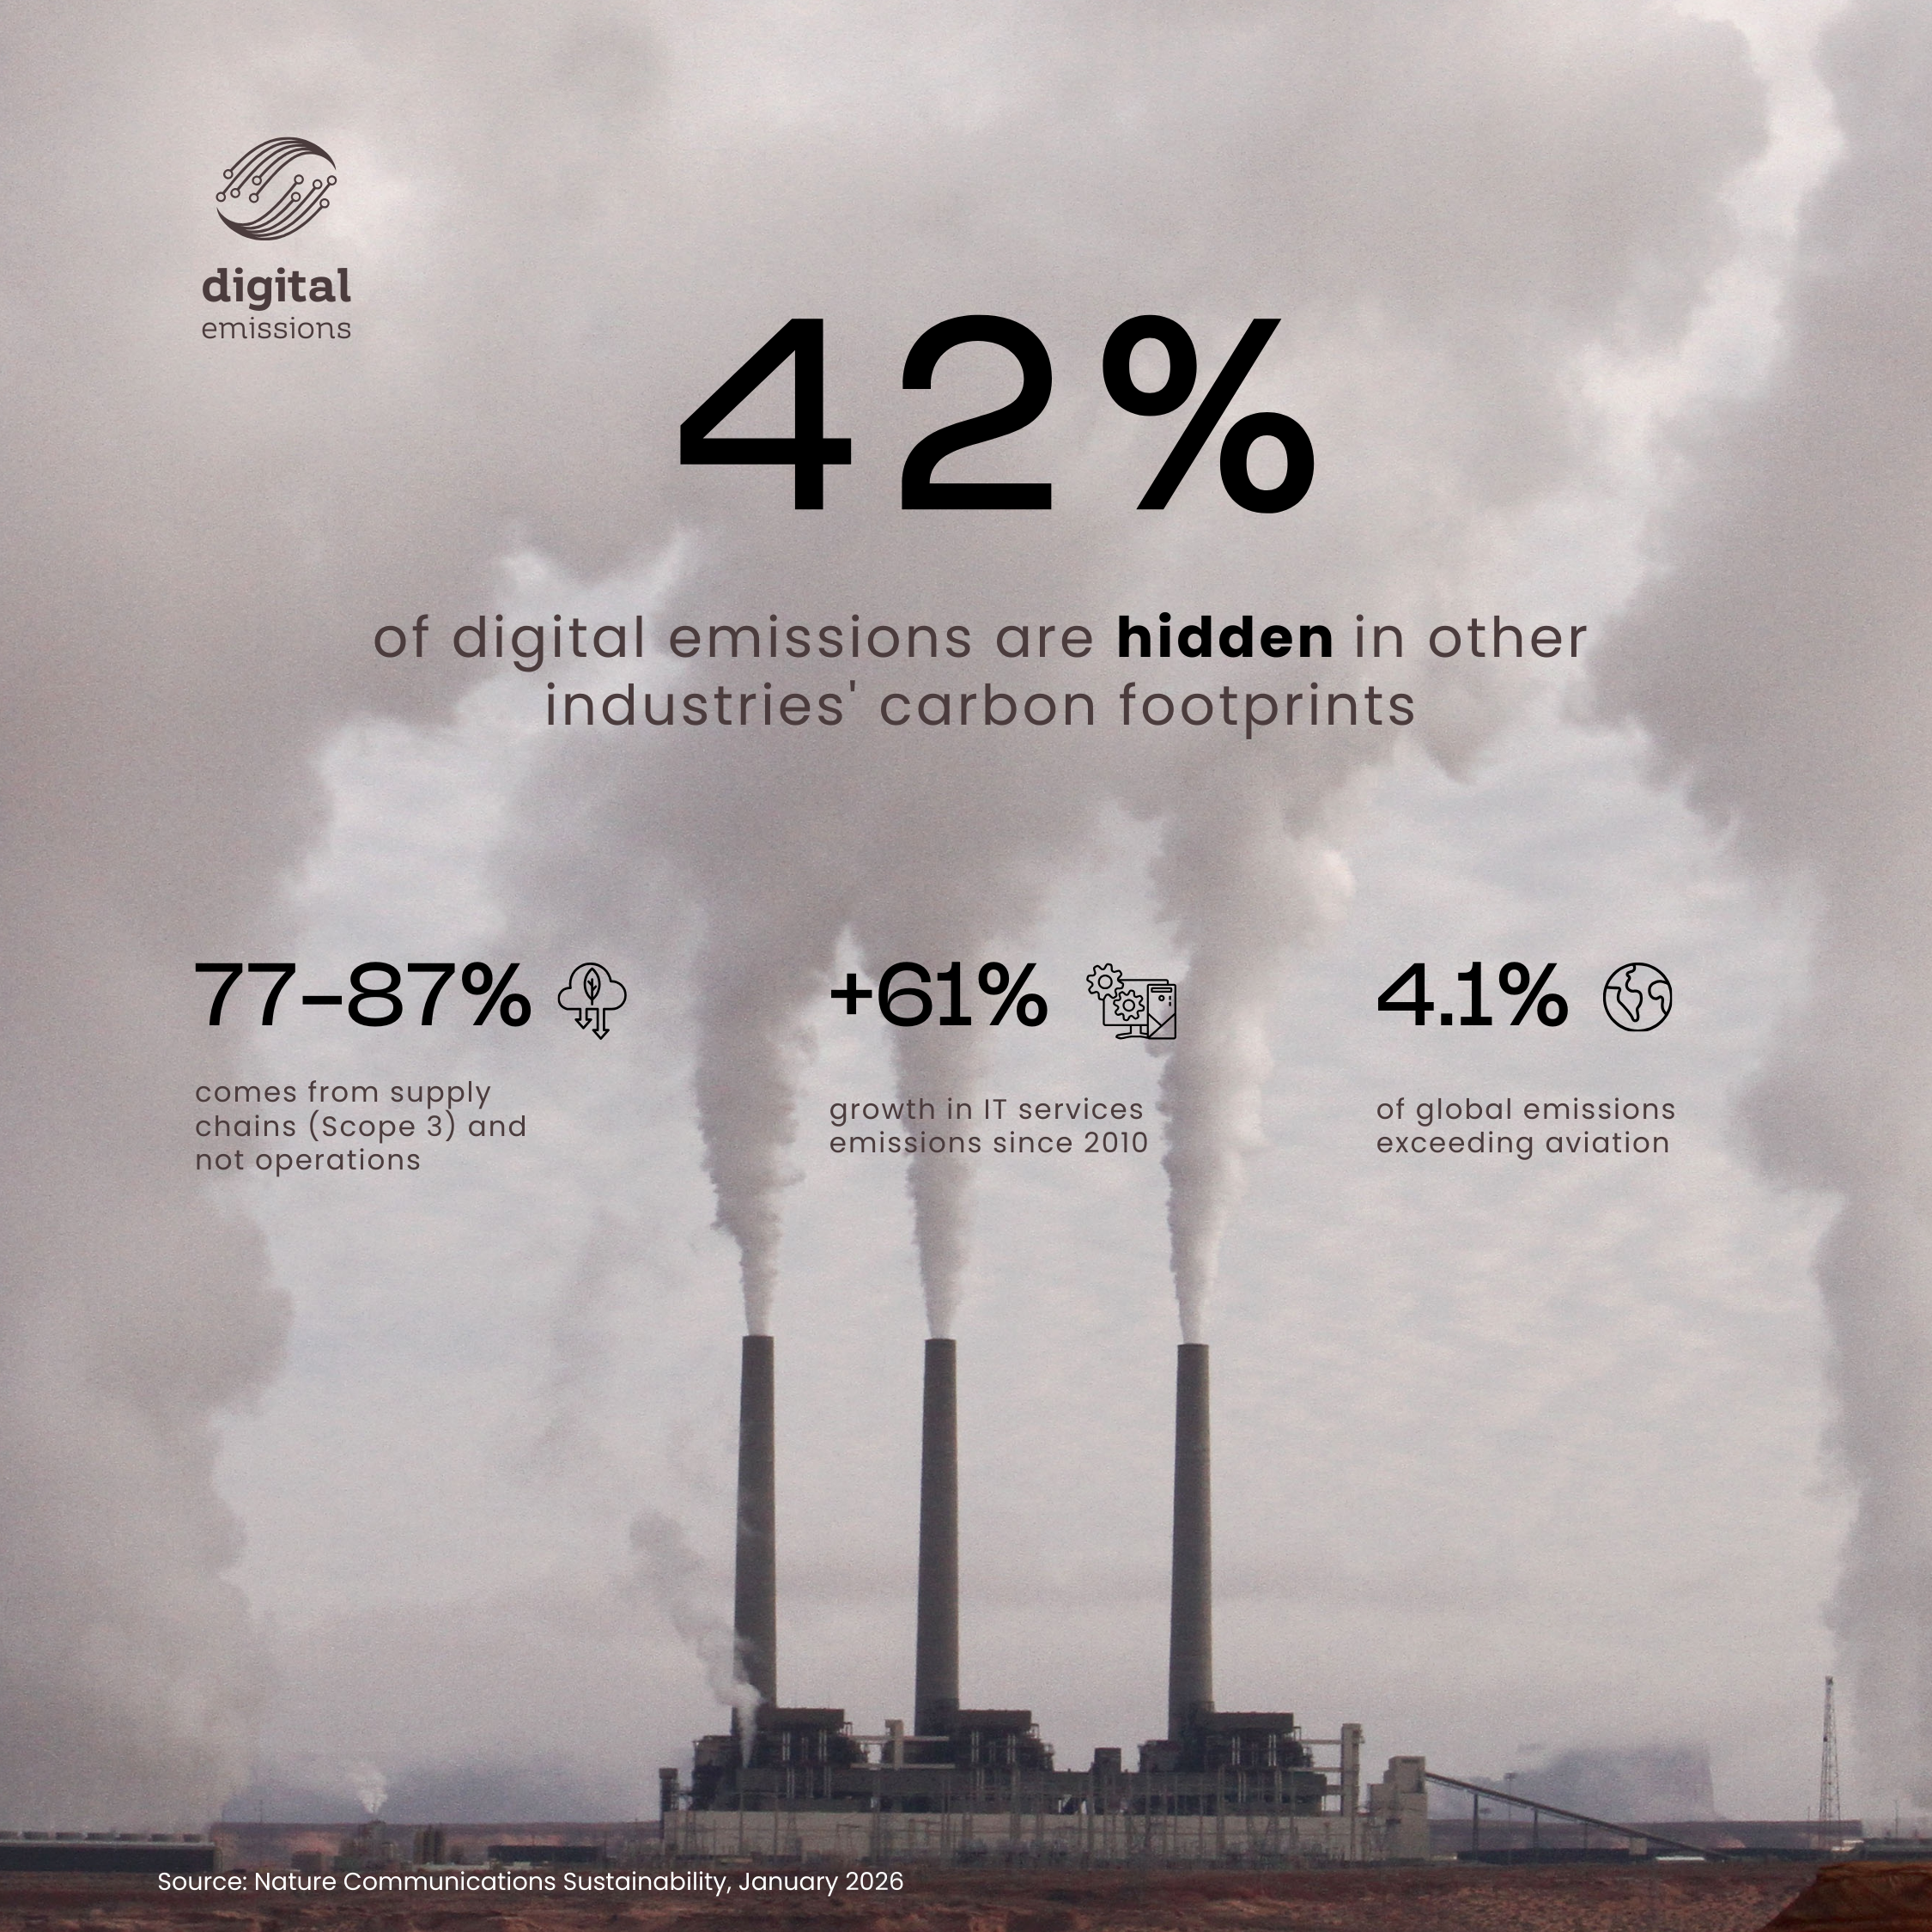
Nearly half of the carbon footprint of our digital world has been hiding in plain sight. A landmark study published in January 2026 in Communications Sustainability, a Nature Portfolio journal, analyzed a full decade of global economic data and found that digital industries are responsible for 4.1% of global greenhouse gas emissions - roughly 2,141 million metric tons of CO2 equivalent in 2021. That's a significant number on its own. But here's what makes this finding especially consequential: 42% of those emissions don't show up as "digital" in anyone's climate accounting. They're embedded in cars, appliances, financial services, and industrial systems, i.e., everywhere digital components serve as intermediate inputs in the broader economy.
A measurement gap with real consequences
The climate impact of digital technologies has been notoriously difficult to pin down, with published estimates ranging from 1.4% to nearly 4% of global emissions depending on methodology. Much of this variation stems from a fundamental limitation in how we account for greenhouse gases. The Greenhouse Gas Protocol, the global standard for corporate emissions reporting, categorizes most supply chain emissions as Scope 3, the most difficult category to measure, report, and verify. For digital industries, this isn't a marginal concern. The study, led by researchers Janna Axenbeck and Stefanie Kunkel along with colleagues at institutions in Germany and France, found that 77–87% of digital industries' embodied emissions fall under Scope 3, generated upstream in mining, metal processing, chemical production, and electricity generation rather than in the data centers and offices that companies directly control.
Previous bottom-up assessments based on life cycle analysis of individual devices and companies, such as work by Malmodin et al. and a 2024 World Bank report, estimated ICT's global footprint at 1.4–1.7%. But these approaches tend to suffer from what researchers call "truncation bias": they draw a boundary around the supply chain and stop counting at a certain point. Freitag et al., adjusting for this bias, estimated a range of 2.1–3.9%, much closer to the 4.1% figure this new study reaches through comprehensive input-output analysis across 45 countries and 64 industries.
The most striking innovation is methodological. By extending the standard Leontief economic framework, the researchers could track emissions from digital technologies that are embedded as intermediate inputs in non-digital industries. Think of the thousands of chips in a modern electric vehicle, the IT infrastructure running a bank's trading platform, or the sensors and connectivity in an industrial automation system. The emissions from producing and operating these digital components get absorbed into the automotive, financial, and manufacturing sectors' footprints, effectively disappearing from digital accounting entirely.
What a decade of data reveals
Three patterns from the 2010–2021 analysis stand out.
First, hardware manufacturing remains the largest source of embodied emissions among the three digital industries (hardware, IT services, and communications), driven by energy-intensive semiconductor fabrication and emissions-heavy raw material extraction. However, hardware's share of final demand emissions actually declined over the period, both in absolute and relative terms. This aligns with growing industry attention to the semiconductor supply chain's environmental footprint, exemplified by the Circular Semiconductors Research Network launched by SEMI and imec in 2025, which identified 69 materials to prioritize for circularity.
Second, IT services represent the fastest-growing emissions category, surging 61% from 2010 to 2021. Demand for IT services more than doubled over the period, and while emission intensity per unit of output improved, these efficiency gains were insufficient to offset the sheer scale of demand growth. Critically, this trend predates the generative AI boom entirely; the study's data ends before ChatGPT's launch in late 2022. The International Energy Agency's 2025 "Energy and AI" report projects that data center electricity consumption alone will more than double to 945 terawatt-hours by 2030, with AI as the primary driver.
Third, the geographic distribution of digital emissions reveals a significant equity dimension. China produces approximately 49% of direct emissions in digital value chains but consumes only about 30% from a consumption perspective, making it a major net exporter of embodied digital emissions. The United States and Europe, conversely, account for roughly 12% of production-based emissions but 25% from a consumption perspective. We benefit from the products while the production-side environmental burden falls disproportionately elsewhere.
The tensions we need to confront
These findings surface uncomfortable trade-offs. The 4.1% figure is almost certainly conservative: the study excludes use-phase emissions from end-user devices and end-of-life disposal, and the authors estimate that adding use-phase emissions alone could increase the total by more than 20%. At the same time, the EU's Carbon Border Adjustment Mechanism doesn't yet cover digital technologies, creating a blind spot in the very framework designed to prevent carbon leakage across borders.
There's also the deeper paradox: digital technologies are simultaneously a major source of emissions and a potentially powerful tool for climate solutions, from smart grids and precision agriculture to materials discovery and climate modeling. Ensuring the net impact remains positive requires an honest accounting of both sides of the ledger.
Pathways to make the invisible visible
The good news is that the tools for better accountability are emerging. Scope 3 reporting under the European Sustainability Reporting Standards has been required since 2024, and the EU's Digital Product Passport, mandated under the Ecodesign for Sustainable Products Regulation, with phased rollout for electronics beginning in 2028, could bring product-level emissions transparency to hardware supply chains for the first time. The study's authors also advocate for "distributed input-output" approaches at the company level, which could give firms and consumers far more accurate carbon performance data than current practices allow.
On the hardware side, extending device lifespans, improving repairability, and fostering markets for refurbished equipment represent some of the most direct levers for reducing the largest source of digital embodied emissions. These principles are already embedded in EU regulatory frameworks and are gaining traction globally.
For IT services, the challenge is more acute. Green software engineering, choosing the most resource-efficient solution for any given computing task, and carbon-aware computing that schedules workloads when and where the grid is cleanest can help. But efficiency alone won't suffice if demand continues to accelerate at the pace we've seen. This is where sufficiency-oriented thinking becomes essential: asking not just "how do we make this service greener?" but "do we need this service at this scale?"
This decade of data from 2010 to 2021 gives us a baseline. It tells us where the emissions have been hiding and why our current accounting has fallen short. The choices we make now, in how we design hardware, engineer software, report emissions, and structure trade policy, will determine whether the next decade tells a very different story.
Sources
Axenbeck, J., Kunkel, S., Blain, J., & Charpentier, F. (2026). "Between 2010 and 2021, global emissions from digital technologies were largely obscured in greenhouse gas emission accounting standards." Communications Sustainability, 1:25. https://doi.org/10.1038/s44458-025-00022-6 — Core source
Freitag, C. et al. (2021). "The real climate and transformative impact of ICT." Patterns, 2, 100340. — Systematic review, truncation bias adjustment
Malmodin, J. et al. (2024). "ICT sector electricity consumption and greenhouse gas emissions—2020 outcome." Telecommunications Policy, 48, 102701. — Bottom-up 1.4% estimate
Ayers, S. et al. (2024). World Bank Group report on ICT emissions and energy. — Bottom-up 1.7% estimate
IEA (2025). "Energy and AI." World Energy Outlook Special Report. — Data center electricity projections (415 TWh in 2024 → 945 TWh by 2030)
SEMI/imec (2025). Circular Semiconductors Research Network. — 69 materials prioritized for circularity
EU ESPR (2024). Ecodesign for Sustainable Products Regulation. — Digital Product Passport framework, phased rollout 2027–2030